2025 Decision Profiles: Decision Styles Across Wizer Users
- Kylee Ingram
- Nov 26, 2025
- 6 min read

If you care about better decisions, it helps to know who is actually making them.
Across 2025, we captured enough Wizer Decision Profiles to see some interesting patterns in decision-making styles by gender and profession.
This dataset is a mix of people using Wizer – individuals taking the profile themselves, plus people completing profiles as part of organisational work. It is not representative of the wider population. It reflects the kinds of people and teams who are already interested enough in decision quality to map it.
At the end of this article, you can download the 2025 Decision Profile Snapshot (PDF) – a slide deck with the charts and percentages.
The 2025 Decision Style Mix: The “Big Three” Decision Profiles
Across all completed Decision Profiles in 2025, the seven Wizer decision styles landed like this (percentages are of completed profiles):
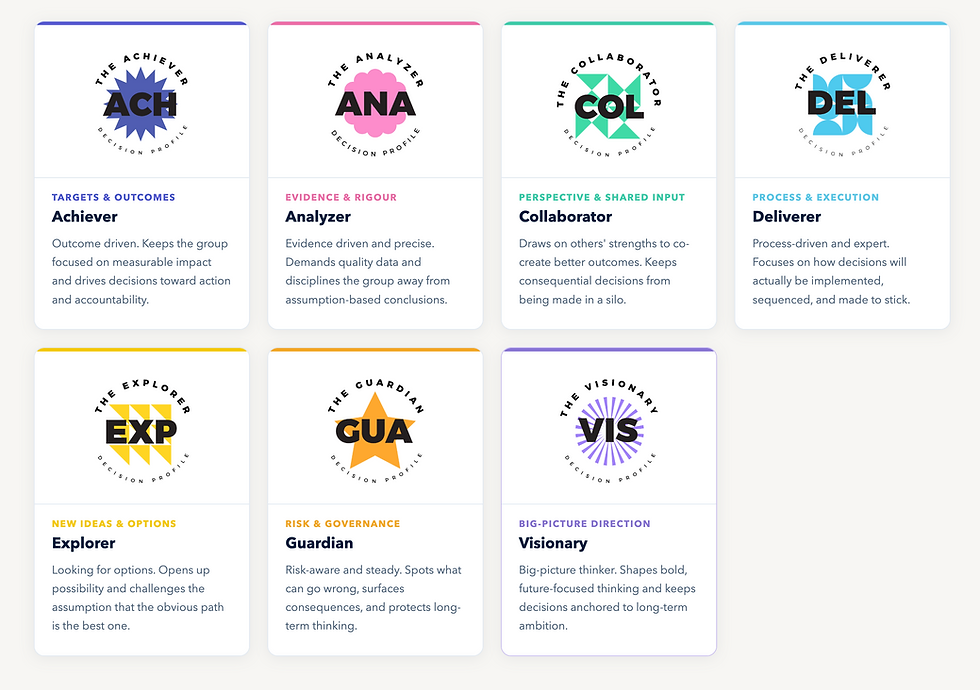
Achiever – 29.0%
Visionary – 23.2%
Collaborator – 21.9%
Deliverer – 10.3%
Guardian – 8.5%
Analyzer – 5.8%
Explorer – 1.3%
What’s interesting is how this pattern sits next to Dr Juliet Bourke’s research on diverse thinking in organisations, where Guardian-type lenses are often the smallest group in leadership teams.
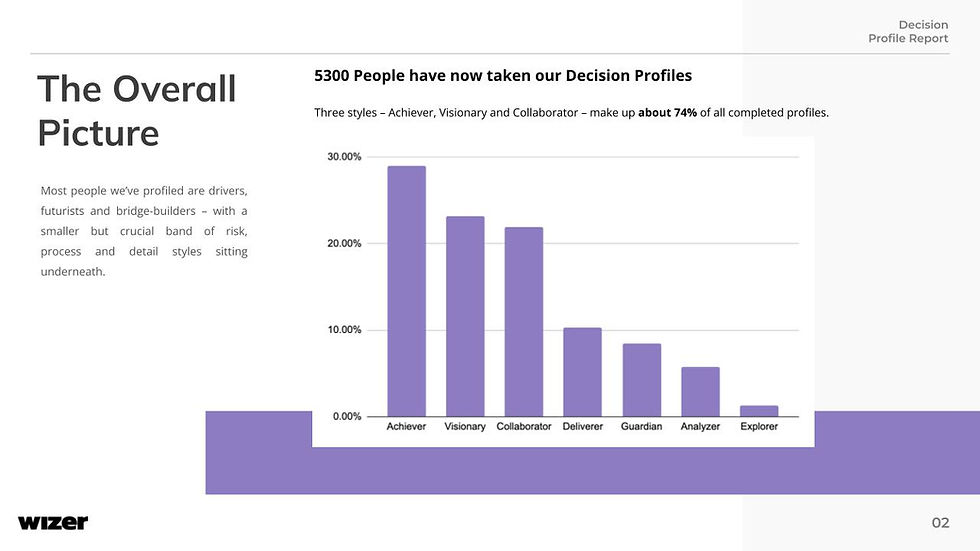
Three Decision Power Profiles clearly dominate in this 2025 Wizer user sample:
Achiever + Visionary + Collaborator account for about 74% of all completed Decision Profiles.
In practice, that means most people who completed Decision Profiles in 2025 are:
Achievers – outcome-driven, focused on results and getting things over the line
Visionaries – future-oriented, pattern-spotting, comfortable with big strategic leaps
Collaborators – relationship-oriented, bringing people into the process to shape outcomes together
The remaining quarter of decision styles sit in the risk, structure and evidence space:
Deliverers keep structure, plans and execution tight
Guardians anticipate risk and protect from downside
Analyzers push for rigour and data
Explorers test edges and alternatives
From a decision intelligence perspective, this matters.There’s plenty of “drive and ideas” in this sample. The thinner coverage is in risk, evidence and process – the territory where Deliverers, Guardians, Analyzers and Explorers usually live.
Gender and Decision Styles
(Wizer users who recorded gender)
Where people recorded gender and completed a Wizer Decision Profile, we can see different emphases in the decision style mix.
Again: this is Wizer user data only, and only from those who chose to record gender. It’s indicative, not definitive.
Women and Decision Profiles
Among women with a completed Decision Profile:
Achiever – 43.5%
Collaborator – 19.6%
Deliverer – 13.0%
Visionary – 13.0%
Analyzer – 4.3%
Guardian – 4.3%
Explorer – 2.2%
Women in this dataset are most likely to profile as Achievers, with meaningful representation across Collaborator, Deliverer and Visionary.
Men and Decision Profiles
Among men with a completed Decision Profile:
Achiever – 28.6%
Visionary – 23.8%
Guardian – 19.0%
Collaborator – 14.3%
Deliverer – 9.5%
Analyzer – 4.8%
Explorer – 0%
Men still lean Achiever, but with a stronger presence of Visionary and Guardian in this subset.
The point isn’t to stereotype anyone. It’s to show that even within broad gender groups, decision-making styles are not uniform. If you treat “women in leadership” or “male executives” as if they all think the same way, you miss the real cognitive diversity (or lack of it) in the room.

Decision Styles by Profession: How Different Roles Decide
One of the most useful views from this 2025 dataset is how decision styles cluster by profession. Where profession was recorded, some distinct patterns emerged.
These numbers are still Wizer users – a mix of individuals and people in organisations using the platform. They don’t claim to represent every profession globally. But they do show how different kinds of work seem to attract (or reward) particular decision styles.
Business, Management and Administration
Achiever – 43.0%
Guardian – 19.0%
Visionary – 14.3%
Collaborator – 9.5%
Deliverer – 9.5%
Analyzer – 4.8%
Business and management roles in this sample are clearly Achiever-heavy, with Guardians as the next most common style. Plenty of drive and risk-awareness; less representation from pure Analyzers and Explorers.
This lines up in an interesting way with Dr Juliet Bourke’s research, which has found that around 75% of CEOs cluster around Outcomes and Options lenses – leaders who are strongly results-focused and ideas-focused. In our framework, a lot of that energy shows up as Achiever (Outcomes) and Visionary, with Explorer (Options) representing the more edge-testing side of Options.
In this business/management group we see:
A strong Outcomes/Options tilt through Achiever and Visionary,
Very few Explorers, and
A noticeable Guardian presence sitting alongside them.
So even inside a function that already skews towards classic CEO-style thinking, the exact decision mix looks different once you separate Achiever, Visionary, Explorer and Guardian into distinct profiles.
Communications Professionals
Achiever – 61.5%
Collaborator – 7.7%
Analyzer – 7.7%
Deliverer – 7.7%
Visionary – 0%
Guardian / Explorer – 0%
In this 2025 Wizer user data, communications professionals are overwhelmingly Achievers.
We saw no Visionary, Guardian or Explorer Decision Profiles recorded in this group.
From a decision intelligence angle, that’s interesting: these are the people shaping narratives, campaigns and stakeholder messaging – and they’re bringing a very strong “get it done” decision style, with much less representation from risk and reframing lenses.
Arts, Culture and Entertainment
Collaborator – 28.6%
Visionary – 28.6%
Explorer – 14.3%
Guardian – 14.3%
Achiever – 14.3%
This group looks more like a small “wise crowd”:
Strong Collaborator and Visionary presence
A spread of Explorer, Guardian and Achiever
No single decision style dominates
For organisations in creative industries, that mix can be a real advantage – if it’s harnessed properly and not flattened by hierarchy.
Sales
Achiever – 50.0%
Collaborator – 33.3%
Visionary – 16.7%
Sales profiles in this dataset sit roughly where you’d expect:
Lots of Achievers pushing outcomes
Strong Collaborator presence for relationship-building
A smaller set of Visionaries thinking about longer arcs and opportunities
For sales leadership, the issue isn’t “how do we get more ambition?” It’s “how do we make sure risk and evidence styles are involved when strategy, pricing or market moves are on the table?”
Education
Visionary – 40.0%
Achiever – 20.0%
Analyzer – 20.0%
Collaborator – 20.0%
Educators in this Wizer sample skew Visionary, with the rest of the group evenly split between Achiever, Analyzer and Collaborator.
That mix fits the work: designing learning, thinking ahead, and balancing outcomes with analysis and relationships.
Science and Technology
Visionary – 40.0%
Deliverer – 20.0%
Achiever – 20.0%
Collaborator – 20.0%
Science and tech roles in our 2025 user data also lean Visionary, backed by a mix of Deliverer, Achiever and Collaborator.
For R&D, product and engineering teams, this suggests plenty of people who can see futures and build them – but fewer classic Guardian/Analyzer profiles. If you’re making high-stakes technical decisions, you may need to deliberately add those voices.
Why These Decision Profile Insights Matter
Taken together, this 2025 snapshot of Wizer users says a few important things about decision-making:
There’s no shortage of ambition or ideas. With Achievers, Visionaries and Collaborators making up around three-quarters of profiles, there’s plenty of energy and intent in the system.
The thinner coverage is in risk, evidence and process. Deliverers, Guardians, Analyzers and Explorers show up less often in this data, especially in some functions (like communications). That’s exactly where decision risk and blind spots tend to live.
Outward diversity doesn’t guarantee decision diversity. You can have a visually diverse room that is still heavily skewed to the same three decision styles. Without making decision profiles visible, it’s hard to see that.
This is why we built Wizer Decision Profiles into the platform – not as personality labels, but as a live signal of how people are likely to approach decisions.
People and organisations use Decision Profiles to:
Map the decision style mix in leadership teams, departments and stakeholder groups
Design stronger decision panels for critical choices
Spot where they’re over-indexed on Achievers and Visionaries
Bring in more Guardians, Analyzers, Deliverers and Explorers when the decision demands it
That’s the heart of decision intelligence: making the people side of decisions visible and actionable, not just relying on org charts and gut feel.
Download the 2025 Decision Profile Snapshot
If you want to see the charts and breakdowns behind these numbers, you can download the slide deck:
The report includes:
The full 2025 decision style mix for Wizer users
The Achiever / Visionary / Collaborator “Big Three” breakdown
Gender subset (where recorded)
Decision styles by profession
Clear notes that this is a non-representative sample based on completed Decision Profiles from people using Wizer
If you’d like to map your own organisation’s decision styles – by team, function or stakeholder group – we can run a focused Decision Profile mapping project and show you your actual mix, not just the org chart.
Pick up a Copy of Dr Juliet Bourke's Book - Which Two Heads are Better than One. (50% off)